Long-term changes and marine statistics
The backbone of the idea of coastDat
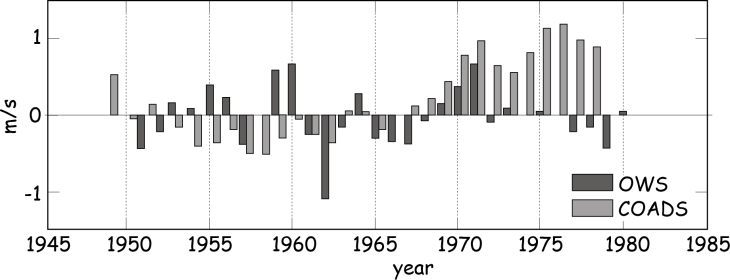
One of the key objectives for developing coastDat was to derive a consistent and mostly homogeneous database for assessing marine weather statistics and long-term changes. Here, homogeneity refers to a data set which is free from effects caused by changes in instrumentation or measurement techniques. The latter is particularly important when long-term changes are considered. As an example, Figure 1 shows wind speed measurement obtained from two different data sources around the same place in the North Pacific. Both time series are expected to carry the same information. However, while one of the data set shows a long-term change in wind speed, the other does not. Obviously, at least one of the data sets is corrupted by changes in the way the observations have been made and is thus not homogeneous.

Figure 1: Annual mean wind speed anomalies in the North Pacific in the area of ocean weather ship P derived from the ICOADS data (light grey) and from measurements aboard ocean weather ship P (dark grey). Graph: Hereon/ Hans-Jörg Isemer
In coastDat techniques developed in atmospheric sciences are used to project the state of the coastal system as known from a finite set of imperfect, irregularly distributed observations onto a regular grid. Procedures are kept fixed over the periods for which the analyses are performed, making the gridded data as consistent and temporally homogeneous as possible.

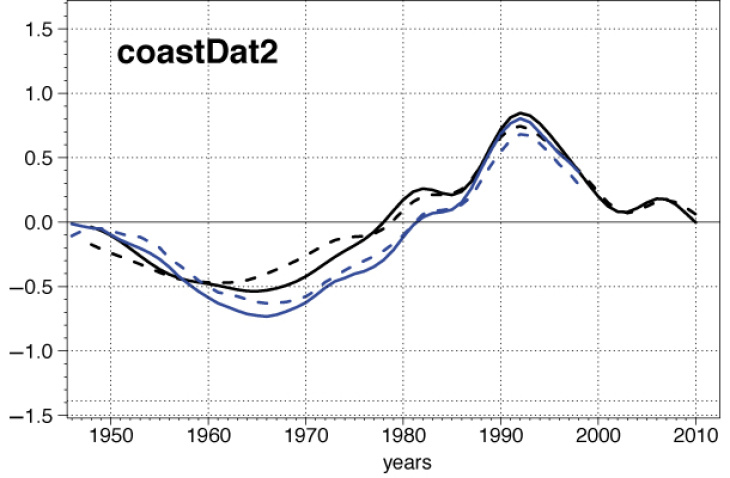
Figure 2: Pressure derived storm indices for Northern Europe derived from observations (blue lines) and from the coastDat database (black lines). Graph: Hereon/ Oliver Krüger
Over the oceans, only a few homogeneous long-term data sets are available to demonstrate the homogeneity of the coastDat record. An example is shown in Figure 2 in which a proxy for storm activity in Northern Europe derived from pressure observations is compared with the same index derived from the coastDat database. While based on pressure observations, the index is considered to be mostly homogeneous as pressure measurements have hardly changed in the course of time and are less affected by small scale changes in the surrounding of the measurement site. Figure 2 illustrates that the qualitative features of long-term changes in storm activity are reasonably covered by the coastDat data, in particular the minimum storm activity around 1960, the subsequent increase until the mid-1990s, and the following decrease.

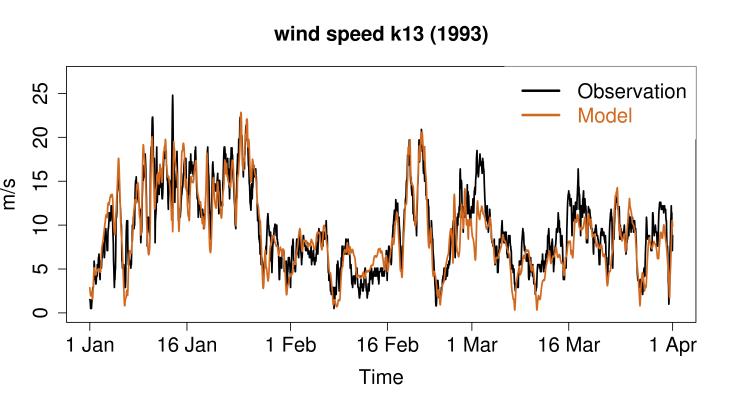
Figure 3: Near-surface marine wind speed at platform K13 in the southern North Sea derived from observations and from the coastDat database. Graph: Hereon/Ralf Weisse
Particular care was taken in analysing the extent to which extreme events are represented by coastDat. As the main emphasis was on reproducing observed weather statistics, individual events may or may not be reasonably reproduced in the coastDat database. Figure 3 illustrates an example for near-surface marine wind speed. While in general there is good agreement when coastDat wind speeds are compared with observations, some extreme events may be over- or underestimated (see events around 1 March) while others are reasonably reproduced (for example between 16 February and 1 March).

Figure 4: Return levels of extreme near-surface marine wind speeds at K13 in the southern North Sea derived from observations (red) and from the coastDat database (blue). Graph: Hereon/ Ralf Weisse
Moreover, Figure 4 displays results on extreme value statistics showing that the observed values are usually reproduced within error bounds. This suggests that coastDat is not necessarily a good database to investigate a given observed extreme event in more detail, but is generally more suited for studying the statistics of such events and their potential long-term changes.
