Marine and offshore energy
Designing, planning and installation of offshore wind farms
Marine and offshore energy
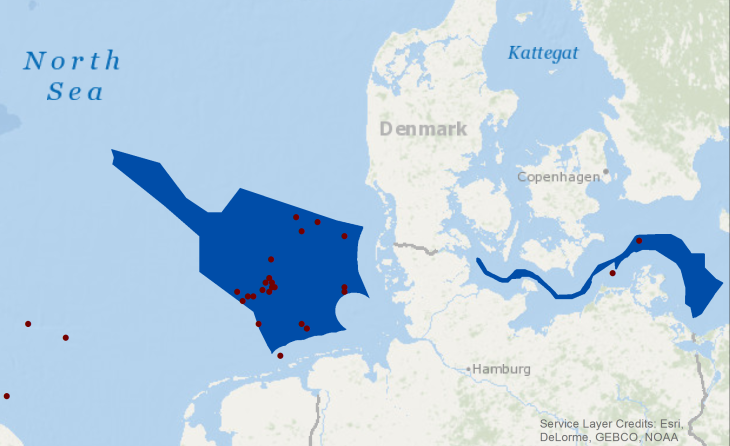
Figure 1: Offshore wind farms (red dots) planned with coastDat data in the North Sea and Baltic Sea; e.g. in the exclusive economic zone (EEZ) of Germany (blue). Map: Hereon/ Elke Meyer
Data from coastDat have been used extensively for example for designing, planning and installation of offshore wind farms. Return periods of extreme wind speed, surge and wave heights are used by a variety of users involved the design and construction of offshore wind parks. Moreover, planning of installation and maintenance requires the estimation of probabilities of weather windows; that is, for example the probability of an extended period with wave heights below a given threshold to enable installation and/or maintenance. Data from coastDat were frequently used in such cases as observational data are too often too short to derive reliable statistics.
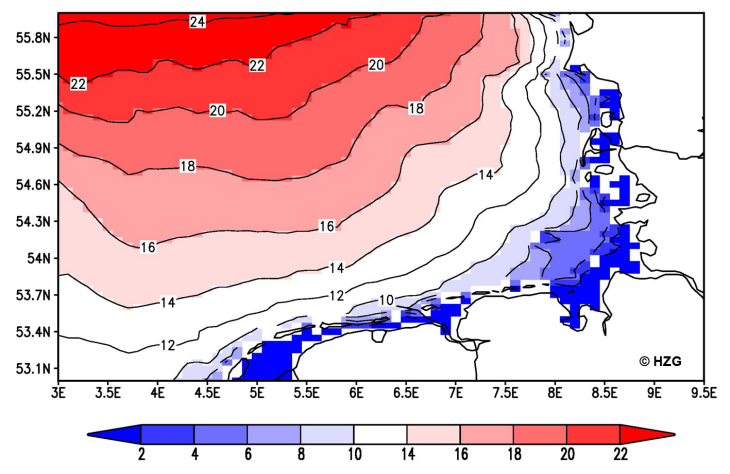
Figure 2: Average 50-year (1958-2007) theoretical wave energy flux (kWm-1) for the south-eastern North Sea. Map: Hereon/ Janina Marx
Data from coastDat were also used to estimate marine energy potential (such as those from waves and currents) along the German North and Baltic Sea coasts (Marx 2010). As an example the long-term 1958-2007 average of the theoretical wave energy flux (depending on significant wave height, wave period and water depth) based on coastDat is shown in Figure 3. Generally, wave energy fluxes are largest further away from the coasts at larger depths and wave heights. Seasonal variability is substantial. Highest wave energy fluxes occur during winter while smallest fluxes are found during summer. From a global perspective, wave energy potential along the German coast line is limited. Marx, 2010
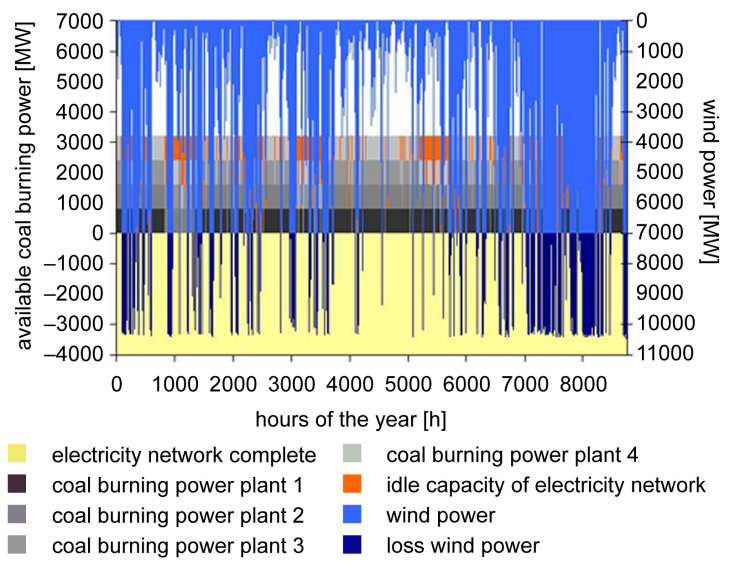
Figure 3: Annual supply of energy from offshore wind parks (blue from top to bottom) and a four block coal burning power plant (black and grey) into the electricity network with a planned capacity of 7,000 MW at Brunsbüttel. When blue lines intersect with the yellow area the land-based network is fully exhausted; the conventional power plant is idle and part of the offshore wind energy supplied is lost. When blue lines intersect with the black and grey blocks the net is feed with energy from offshore wind and partly from the conventional power plant operating at reduced load. Only when there is no intersection and last block is marked in orange there is idle capacity of the electricity network (after Wiese 2008). Graph: Frauke Wiese
Offshore wind farms need to be connected with the land based grid. Such connections can be established at a few points only with limited capacity. Data from coastDat were used by Wiese (2008) to simulate the impacts on the national grid for a scenario in which all planned offshore wind farms in the German exclusive economic zone in the North Sea are fully operational. Figure 4 shows an example of this analysis in which the efficiency of newly planned coal-burning power plant at a point connecting offshore wind farms with the land based grid with a planned capacity of 7,000MW was estimated. As the German renewable energy law requires that available wind energy is introduced into the grid, the four 800 MW coal-burning power plants are expected to have noticeably less base-load hours as planned and the frequent run-ups and run-downs of the conventional power plant are expected to decrease the efficiency of the energy production. Wiese, 2008
Climatology of North Sea wind energy
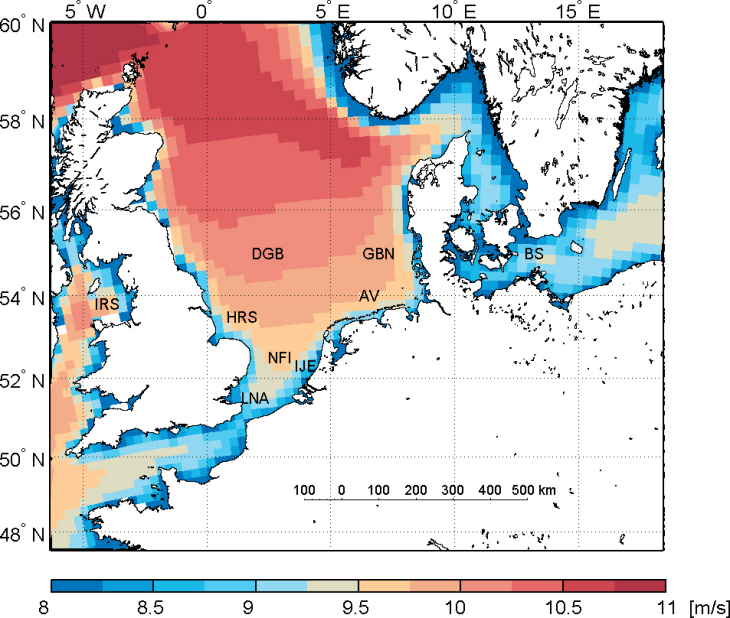
Figure 4: Long-term average wind speeds (m/s) at a height of 100 m for the period of 1958–2012. The locations of the planned wind parks are labelled using the abbreviations listed in (Geyer et al., 2015; Table 2).
Map: Hereon/ Beate Geyer
Model-based wind speed data derived from the coastDat-2 atmospheric data set for the North Sea were used to assess wind power potential considering both spatial and temporal variability (Geyer et al., 2015). Following conclusions were drawn by the study: a) Inter-annual to decadal variability plays an important role in wind energy; wind power estimates based on short observational time series, particularly from the late 1990s, may exhibit high biases. b) Up-scaling from wind speeds at a height of 10 m using conventional power laws may result in similar biases. c) On inter-annual to decadal time scales, synergies are not expected from the different arrays in the North Sea, i.e., a decrease in the power output of an array may not be balanced by another. Instead, the joint production by all arrays is characterized by higher volatilities compared with that from a single array. Geyer et al., 2015
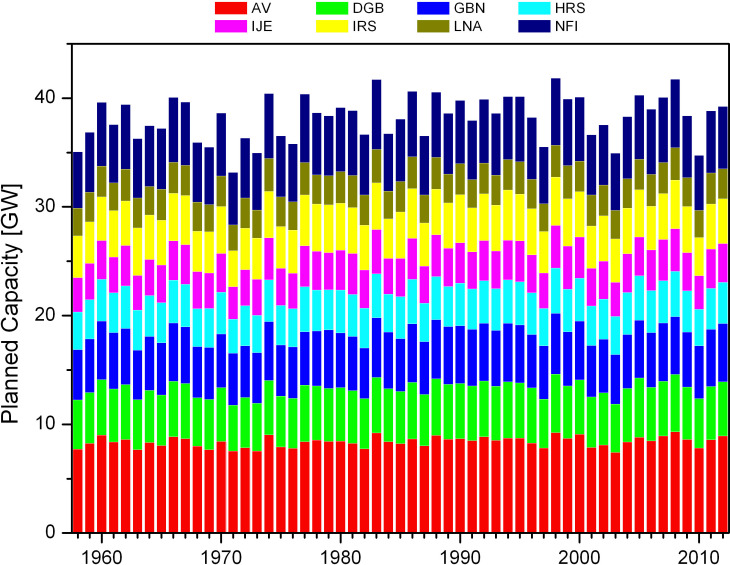
Figure 5: Time series of annual power output of eight major arrays planned in the North Sea using hourly wind speeds from our coastDat-2-data, the synthetic power-velocity curve and the planned capacities given in Geyer et al., 2015; Fig. 4 and Table 2, respectively. Wake and line losses and losses due to operational unavailability are not taken into account. Graph: Hereon/ Beate Geyer
