Features
Pydidas aims to provide a user interface which gives users all the necessary tools to work with their diffraction data.:
- Data browsing (including hdf5 files)
- Detector calibration (using pyFAI calibration tools)
- Definition of experiment and scan
- Workflow assembly
- Testing workflows and tweaking processing parameters
- Running workflows (using parallelization)
- Result visualization
- Result export
Pydidas is still being developed further. If you are missing features, please get in
touch (see contact) to describe your needs and discuss how these could be
implemented in pydidas.
Data browsing
- Browse through the full file system
- Visualize image data with a single click
- Support for hdf5 files: - Select different hdf5 datasets
- View individual frames
Detector calibration
Use the pyFAI calib2 tool conveniently from within pydidas
- Allows export of calibration results
- Calibration results can be used further in pydidas directly without the need to export a file
Workflow editing interface
- Browse through all available plugins (and show detailed information for all plugins)
- Add plugins to and configure plugins in the workflow
- Re-arrange the workflow tree
pydidas data processing
- Required information separated in three segments which can each be easily reused: - The Experiment defines X-ray energy, detector and geometry
- The Workflow configures the data processing steps
- The Scan defines file names, data paths and scan points - All configurations can be exported from and re-imported into pydidas
- Workflows are defined from individual plugins for each step for high flexibility.
- Pydidas supports branching workflows
- Pydidas plugins are simple to write and users can add their own plugins for specialized analysis features.
Testing workflows
Pydidas includes an interface to test the workflow on a single data point:
- Access all intermediate results
- Inspect individual plugins
- Tweak plugin parameters and check their impact on results
Running workflows
- Workflows can be run from the GUI using multiple background processes for parallelization
- Processing can also be started from the command line, for example on clusters
- Results can be visualized in real time as the processing progresses
- Any result (subset) can be plotted as 1d graph or 2d image
- All scan dimensions can be squeezed to a scan timeline for visualization
Additional tools
Pydidas includes additional convenience tools to facilitate data processing
- Process image series (sum / average), for example to average background images for calibration (including hdf5 support).
- Load and edit detector masks (using the ESRF silx widget)
- Directory spy to display the latest data file in the selected directory
- Composite creator to tile individual images
Gallery
-
 Data browsing: Browse through the full file system (including network drives) and display data with a single click,
 -
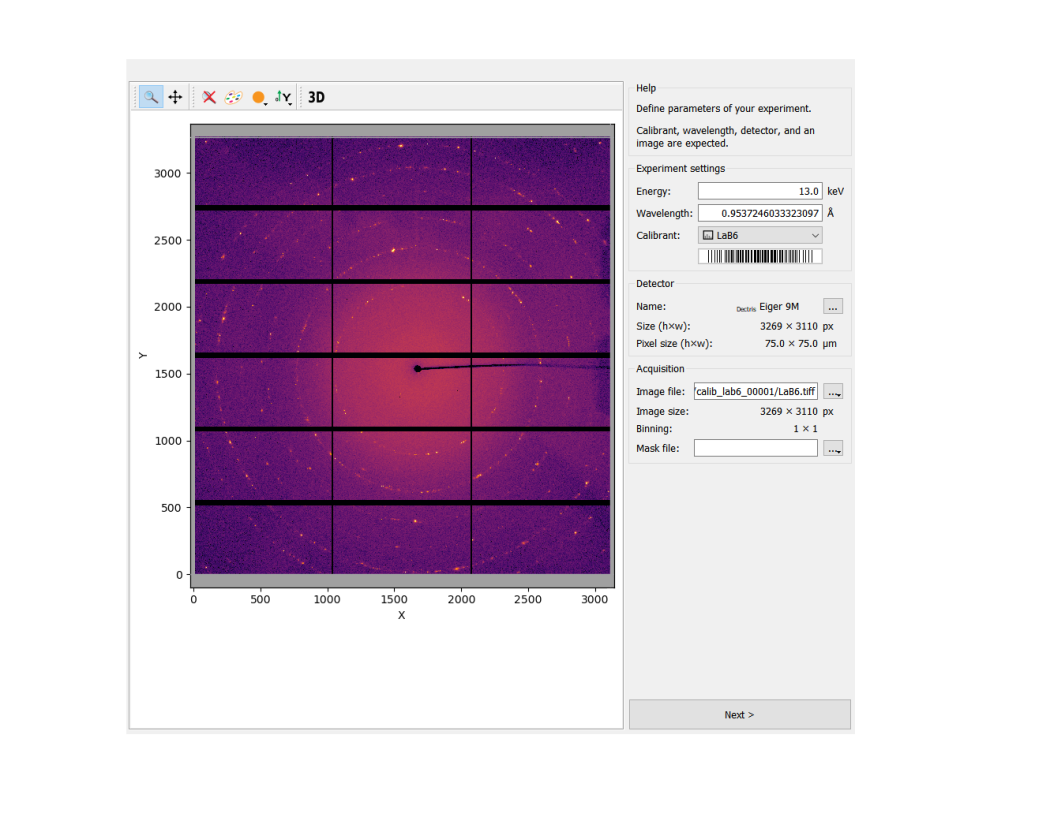 Detector calibration: Integration of the pyFAI calib2 tool (developed by ESRF) for easy data calibration within pydidas.
 -
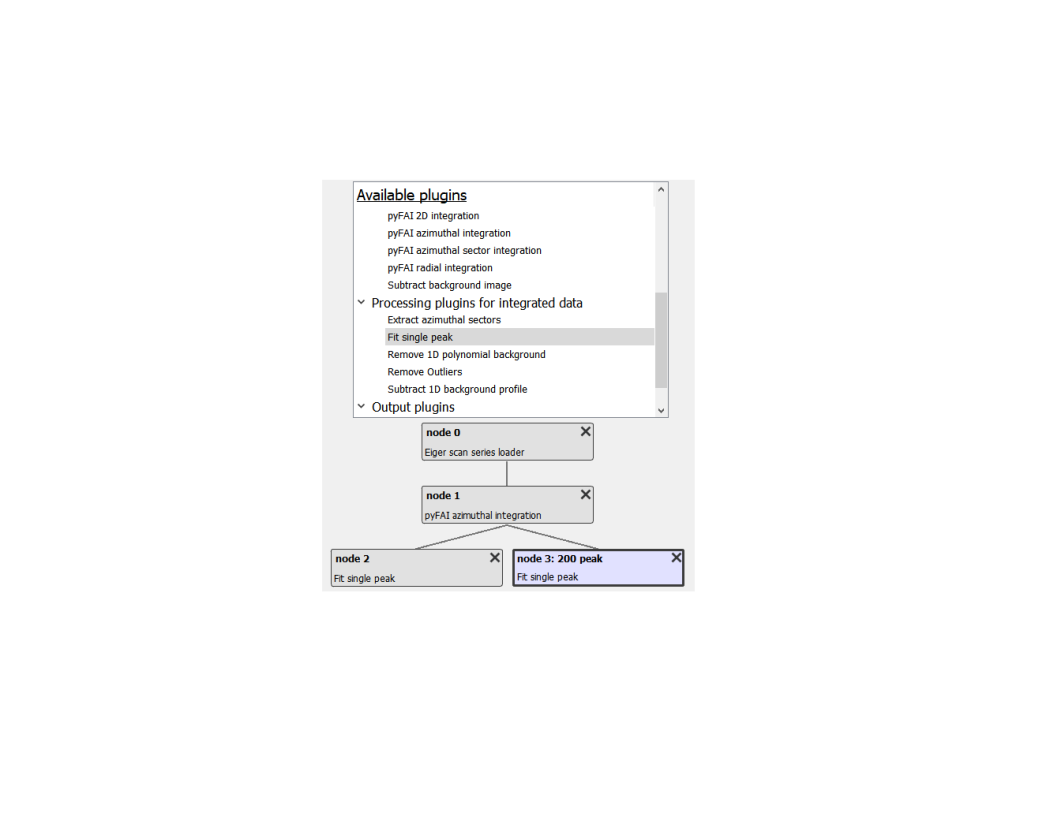 Workflow editing: Browse through all available plugins, display plugin descriptions and add plugins to the workflow. In addition, all plugin parameters can be tweaked and the order of plugins can be rearranged.
 -
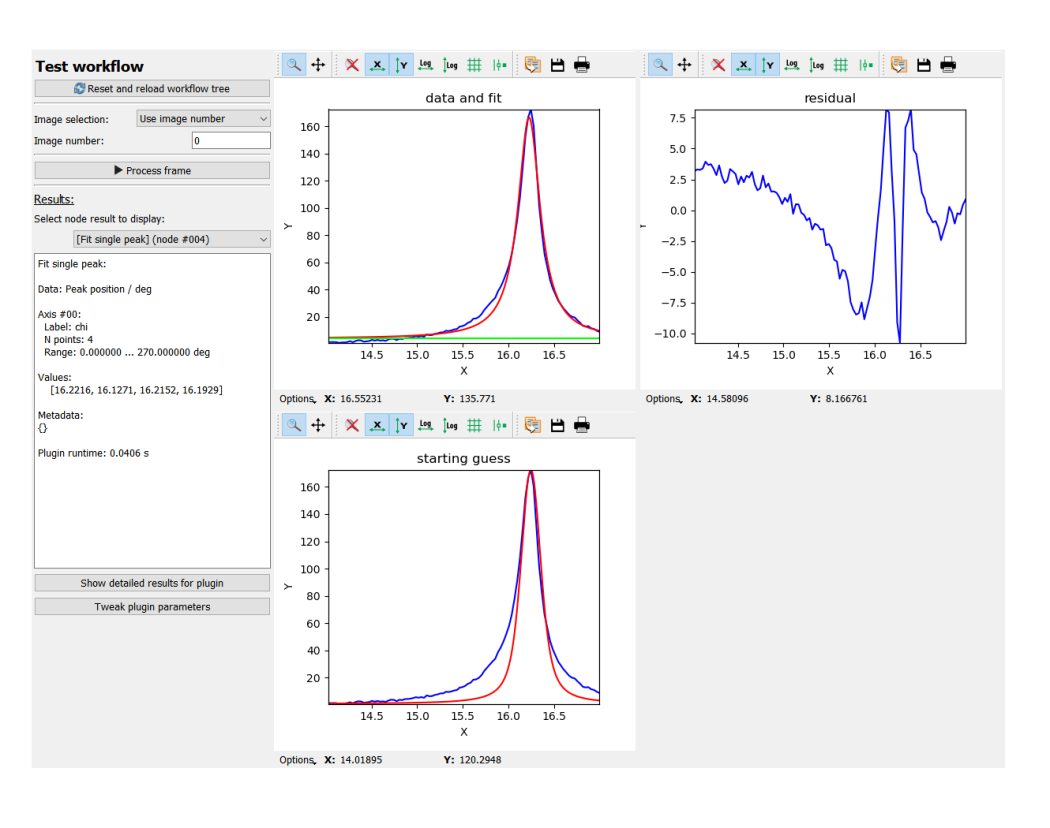 Test workflows: Test the workflow and visualize results for all plugins. Detailed results give more information than the simple plugin result.
 -
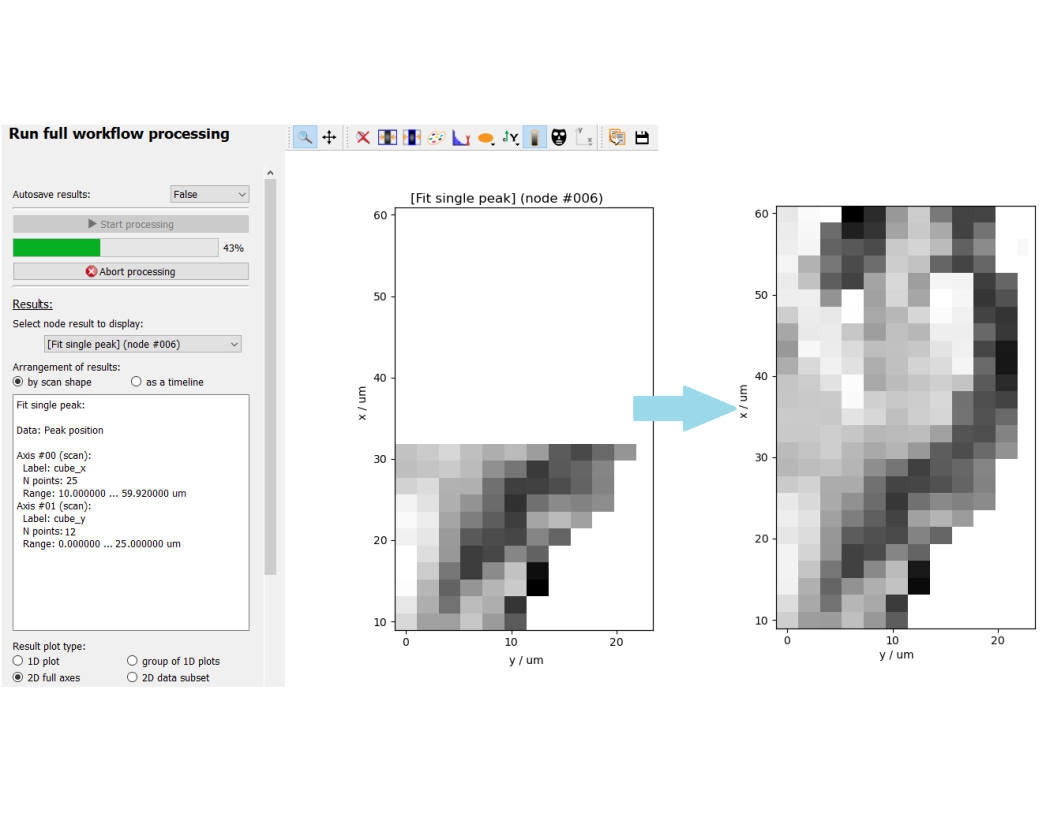 Running workflows: Workflows can be run in background processes (which allows to keep the user interface responsive). Results can be visualized as soon the respective datapoints have been processed.