Nitrogen dioxide NO2
Sources
Nitrogen dioxide (NO2) is a gas of the group nitrogen oxides (NOx). These gases are formed when fuel is burned at high temperatures. Mobile sources are motor vehicle exhaust and industrial combustion from power plants or industrial boilers are stationary sources. Nitrogen dioxide is a strong oxidizing agent that reacts in the air to form corrosive nitric acid or particulate toxic organic nitrates (NO3). In the presence of sunlight it also forms ground-level ozone (O3) (or smog).
Health effects
Nitrogen dioxide can irritate the lungs and lead to respiratory diseases such as influenza. Frequent exposure to short term high concentrations may cause increased incidence of acute respiratory desease in children.
Environmental impacts
Nitrogen oxides significantly contribute to environmental effects such as acid rain and eutrophication in coastal waters like the North and Baltic Seas. Eutrophication is the reduction of oxygen in a water body through an increase in nutrients. This leads to an increased algae growth, an accelerated degradation and the use of oxygen to the point of oxygen deficiency and so called death zones for fish.
Reference concentrations
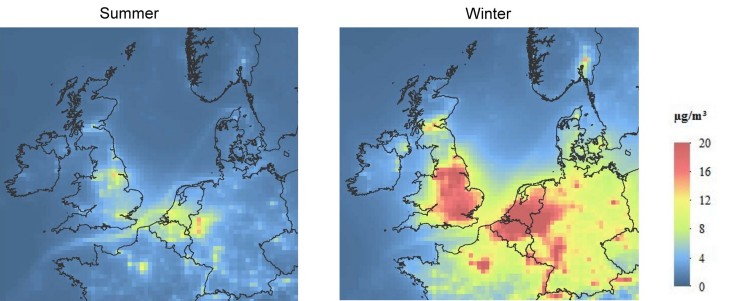
NO2 concentrations are much lower in summer than in winter. Single hot spots are visible in western Germany and the Netherlands. In the winter months major cities and populated areas are displayed on the map with a concentration of more than 20 µg/m3, which is due to an increased heating energy demand and favored meteorological conditions for particle formation within the cold season.
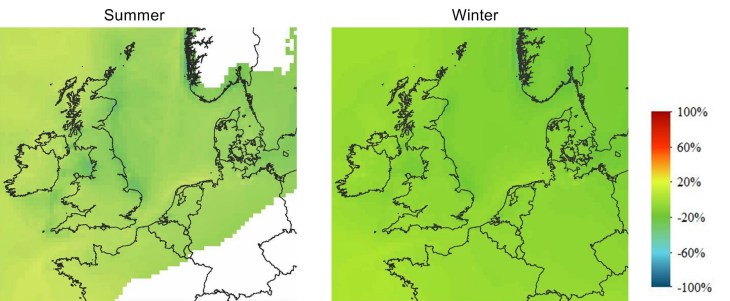
Relative contribution of ships to NO2 concentrations

The relative contribution of ships is higher in the summer months, which is mainly due to overall lower NO2 concentrations within the warmer season. The contribution of ships to the lower concentrations over the English Channel and on the main shipping routes are up to 100 % during summer.
Scenario No ECA: NO2 Concentration Change

A steady increase in shipping activity is reflected by an increase in the contribution of shipping to the average NO2 concentrations by more than 30% in large areas of the North Sea. The largest increase can be seen in the English Channel and the south western North Sea. The reduction has a similar magnitude and regional distribution in winter and summer.
Scenario ECA SCR 21: NO2 Concentration Change

In large parts of the North Sea the contribution of shipping to the NO2 concentrations in 2030 will be higher than the contribution today. This is owed to the large part of the fleet (Tier III is only valid for ships build after 2021) which is still following the less strict Tier II and I regulations. The reduction has a similar magnitude and regional distribution in winter and summer.
Scenario ECA SCR 16: NO2 Concentration Change
This scenario shows a moderate increase of the NO2 concentrations caused by ships compared to the reference year. The small concentration decrease in the Channel compared to other parts of the North Sea results from an increasing traffic to the main ports Hamburg, Rotterdam and Antwerp. Many of the smaller and older ships traveling to the smaller harbours today will then be replaced by new ships that will comply to the Tier III regulations. The reduction has a similar magnitude and regional distribution in winter and summer.
Scenario ECA opt: NO2 Concentration Change

A reduction of approximately 80% compared to the reference year 2011 all over the North Sea is achieved in this scenario, where all ships comply with Tier III. The reduction has a similar magnitude and regional distribution in winter and summer.