Nitrate NO3
Sources
The primary source of nitrate is agriculture, where it is spread on field as manure or in form of fertilizer. It is also released into the atmosphere trough combustion processes.
Health effects
Nitrate often contaminates drinking water in agricultural areas. Water too high in nitrates can lead to serious infant illness or even death. Symptoms are shortness of breath and blue-tinted skin (known as blue baby syndrome).
Environmental impacts
Nitrate leads to numerous environmental problems as e.g. harmful algal blooms, which sometimes create toxins that can kill fish and other animals. These toxins move up the food chain and hurt larger animals like sea lions, turtles, dolphins, birds, manatees, and fish. Even if they are not toxic, they lead to Eutrophication - the reduction of oxygen in a water body through an increase in nutrients – so called dead zones for fish. Acid rain is another environmental impact of, among others, NO3. Caused by nutrient pollution in the air it damages lakes, streams, estuaries, forests and grasslands.
NO3 concentrations
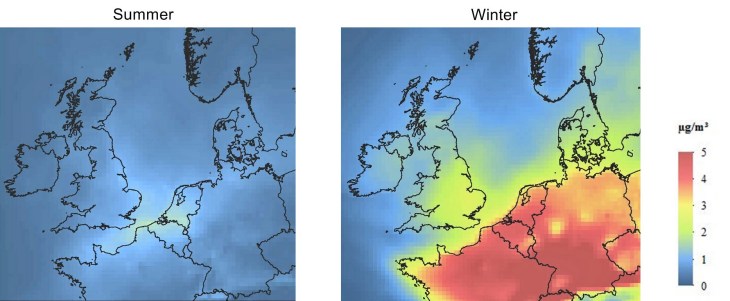
The NO3 summer concentrations are much lower than the winter concentrations. The over land winter concentrations between 4 and 5 µg/m3 are extensively spread out due to an increased heating energy demand and favored meteorological conditions for particle formation within the cold season.
Relative contribution of ships to NO3 concentrations
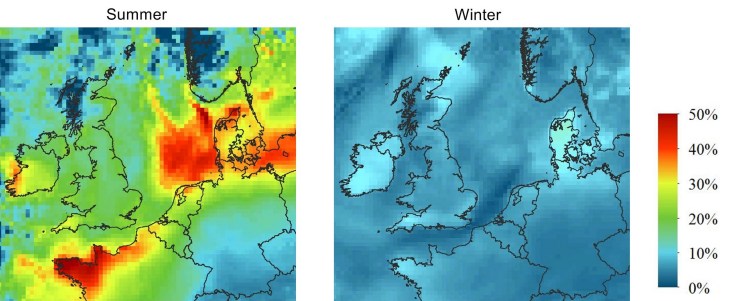
The relative contribution of ships is higher in the summer months, which is mainly due to overall lower NO3 concentration within the warmer season. The contribution of ships to the concentrations is not so much bound to the shipping routes as it has been seen for NO2, which is due to NO3 particles are transported over greater distances.
Scenario No ECA: NO3 Concentration Change
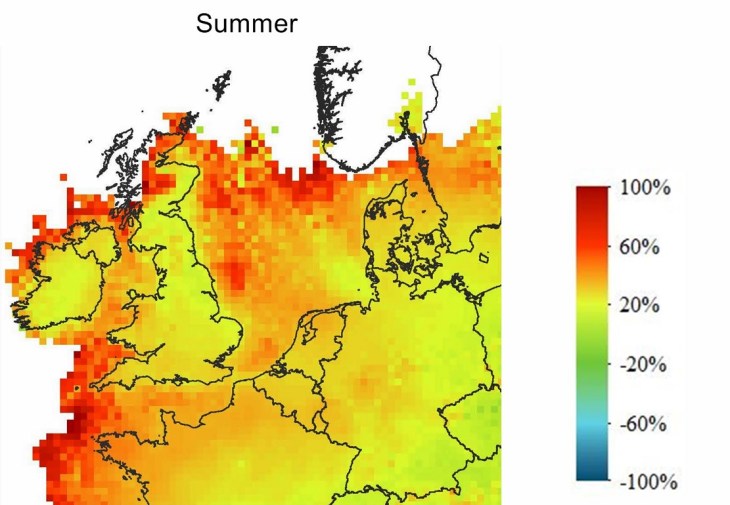
In this scenario the contribution of shipping increases by more than 30% on average over sea and more than 25% over land area. The winter concentrations of nitrate aerosols are not presented as they are only marginally affected by shipping emissions.
Scenario ECA SCR 21: NO3 Concentration Change
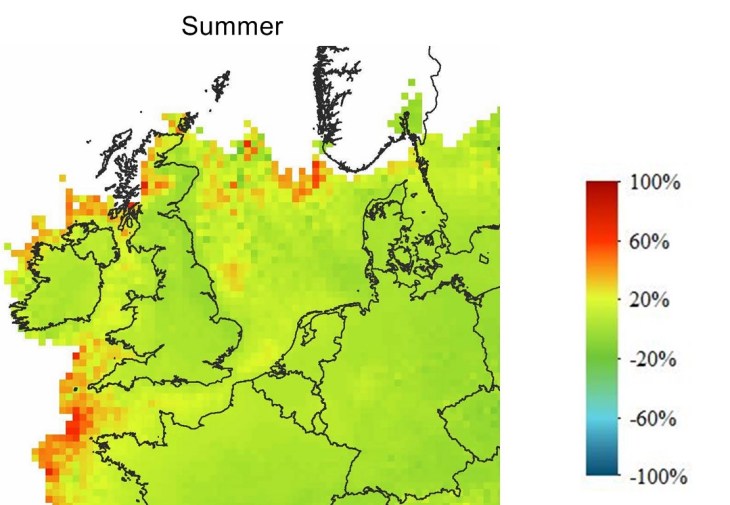
This scenario shows an increase in NO3 from shipping for large areas while others remain unchanged compared to the reference year 2011. The winter concentrations of nitrate aerosols are not presented here as they are only marginally affected by shipping emissions.
Scenario ECA SCR 16: NO3 Concentration Change

A decrease of the contribution of shipping to the NO3 concentrations of about 10% in the north western part is presented in the maps while a small increase of 5-10% can be observed for the south western part. The winter concentrations of nitrate aerosols are not presented here as they are only marginally affected by shipping emissions.
Scenario ECA opt: NO3 Concentration Change
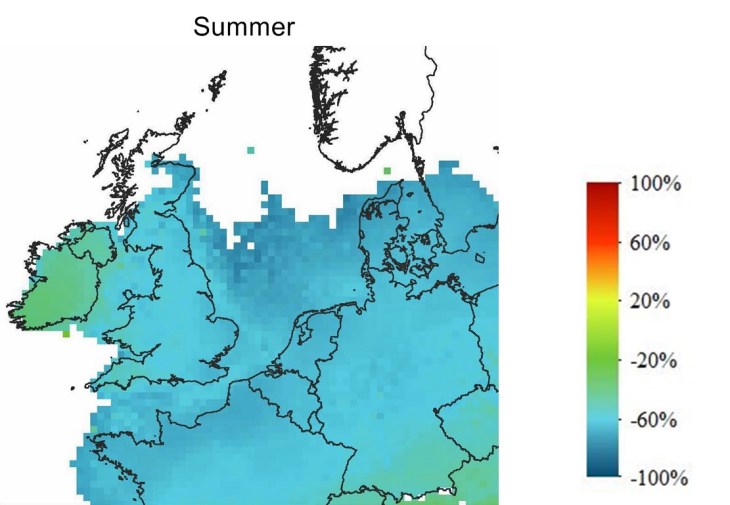
The contribution of shipping to nitrate aerosol (NO3) concentrations will be reduced by 60 – 80%, provided that all ships comply with the Tier III regulations. The winter concentrations of nitrate aerosols are not presented on this website as they are only marginally affected by shipping emissions.